\usepackage{tikz}
\shorthandoff{:}\begin{tikzpicture}[scale=1]
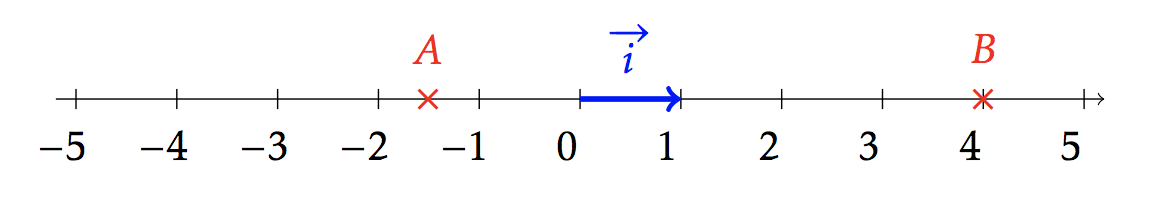
\draw[->] (-5.2,0) -- (5.2,0) node[right] {};
\foreach \x in {-5,...,5} {
\draw (\x,0.1cm) -- (\x,-0.1cm) node[below] {$\x\phantom{-}\strut$};
}
\draw[->,color=blue,ultra thick] (0,0) -- (1,0) node[right] {};
\draw (0.5,0.5) node [color=blue] {$\overrightarrow{i}$};
\draw (-1.5,0) node [color=red] {$\times$} node [color=red,above=0.5cm] {$A$};;
\draw (4,0) node [color=red] {$\times$} node [color=red,above=0.5cm] {$B$};
\end{tikzpicture}\shorthandon{:}\\
\shorthandoff{:}\begin{tikzpicture}[xscale=2,yscale=0.15]
\draw[->,thick] (-2.1,0) -- (4.1,0) node[right] {};
\draw[->,thick] (0,-41) -- (0,81) node[above] {};
\draw[xstep=0.1cm,ystep=2cm,gray,very thin] (-2,-40) grid (4,80);
\draw[xstep=1cm,ystep=10cm,gray,thin] (-2,-40) grid (4,80);
\foreach \x in {-2,...,-1} {
\draw (\x,0.1cm) -- (\x,-0.1cm) node[below] {$\x\phantom{-}\strut$};
}
\foreach \x in {1,...,4} {
\draw (\x,0.1cm) -- (\x,-0.1cm) node[below] {$\x\strut$};
}
\foreach \y in {-40,-20} {
\draw (0.1cm,\y) -- (-0.1cm,\y) node[left] {$\y\strut$};
}
\foreach \y in {20,40,...,80} {
\draw (0.1cm,\y) -- (-0.1cm,\y) node[left] {$\y\strut$};
}
\node[below left=0.1cm] at (-0,0) {$0\strut$};
\end{tikzpicture}\shorthandon{:}\\

\shorthandoff{:}\begin{tikzpicture}[scale=1.5]
\draw[->] (-1,0) -- (5,0) node[right] {};
\draw[->] (0,-1) -- (0,5) node[above] {};
\draw[dashed] (3,2cm) -- (3,-0.1cm) node[below] {$x_{A}$};
\draw [dashed](3cm,2) -- (-0.1cm,2) node[left] {$f(x_{A})$};
\node[below left=0.1cm] at (-0,0) {$0\strut$};
\begin{scope}
\clip (-1,-1) rectangle (5,5);
\draw[domain=-1:5,color=black,samples=100] plot ({\x},{exp(\x-3)+1}) ;
\draw (4,4.5) node [color=black] {$\mathcal{C}_{f}$};
\draw (3,2) node [color=black] {$\times$};
\draw (3,2.5) node [color=black] {$A$};
\draw[domain=-1:5,color=red,samples=100] plot ({\x},{\x-1}) ;
\draw (4,3.5) node [color=red] {};
\end{scope}
\draw[->,color=blue,ultra thick] (3,2) -- (4,2) node[right] {};
\draw (3.5,1.5) node [color=blue] {1};
\draw[->,color=blue,ultra thick] (4,2) -- (4,3) node[right] {};
\draw (4.5,2.5) node [color=blue] {$f'(x_{A})$};
\end{tikzpicture}\shorthandon{:}\\

\shorthandoff{:}\begin{tikzpicture}[yscale=.05]
\draw[->] (-2.5,0) -- (7.5,0) node[right] {};
\draw[->] (0,-65) -- (0,125) node[above] {};
\foreach \x in {-2,...,-1} {
\draw (\x,0.1cm) -- (\x,-0.1cm) node[below] {$\x\phantom{-}\strut$};
}
\foreach \x in {1,...,7} {
\draw (\x,1cm) -- (\x,-1cm) node[below] {$\x\strut$};
}
\foreach \y in {-60,-40,-20} {
\draw (0.1cm,\y) -- (-0.1cm,\y) node[left] {$\y\strut$};
}
\foreach \y in {20,40,...,120} {
\draw (0.1cm,\y) -- (-0.1cm,\y) node[left] {$\y\strut$};
}
\node[below left=0.1cm] at (-0,0) {$0\strut$};
\begin{scope}
\clip (-2.5,-65) rectangle (7.7,125);
\draw[domain=-1:7,color=blue,samples=100] plot ({\x},{1.5*\x^4-10*\x^3+12*\x^2+2}) ;
\draw (4,3.5) node [color=blue] {$\mathcal{C}_{f}$};
\end{scope}
\end{tikzpicture}\shorthandon{:}\\
\shorthandoff{:}\begin{tikzpicture}[scale=0.8]
\draw[->] (-5,0) -- (5,0) node[right] {};
\draw[->] (0,-5) -- (0,5) node[above] {};
\draw[xstep=1cm,ystep=1cm,style=help lines] (-4,-4) grid (4,4);
\foreach \x in {-4,...,-1} {
\draw (\x,0.1cm) -- (\x,-0.1cm) node[below] {$\x\phantom{-}\strut$};
}
\foreach \x in {1,...,4} {
\draw (\x,0.1cm) -- (\x,-0.1cm) node[below] {$\x\strut$};
}
\foreach \y in {-4,...,-1} {
\draw (0.1cm,\y) -- (-0.1cm,\y) node[left] {$\y\strut$};
}
\foreach \y in {1,...,4} {
\draw (0.1cm,\y) -- (-0.1cm,\y) node[left] {$\y\strut$};
}
\node[below left=0.1cm] at (-0,0) {$0\strut$};
\begin{scope}
\clip (-4,-4) rectangle (4,4);
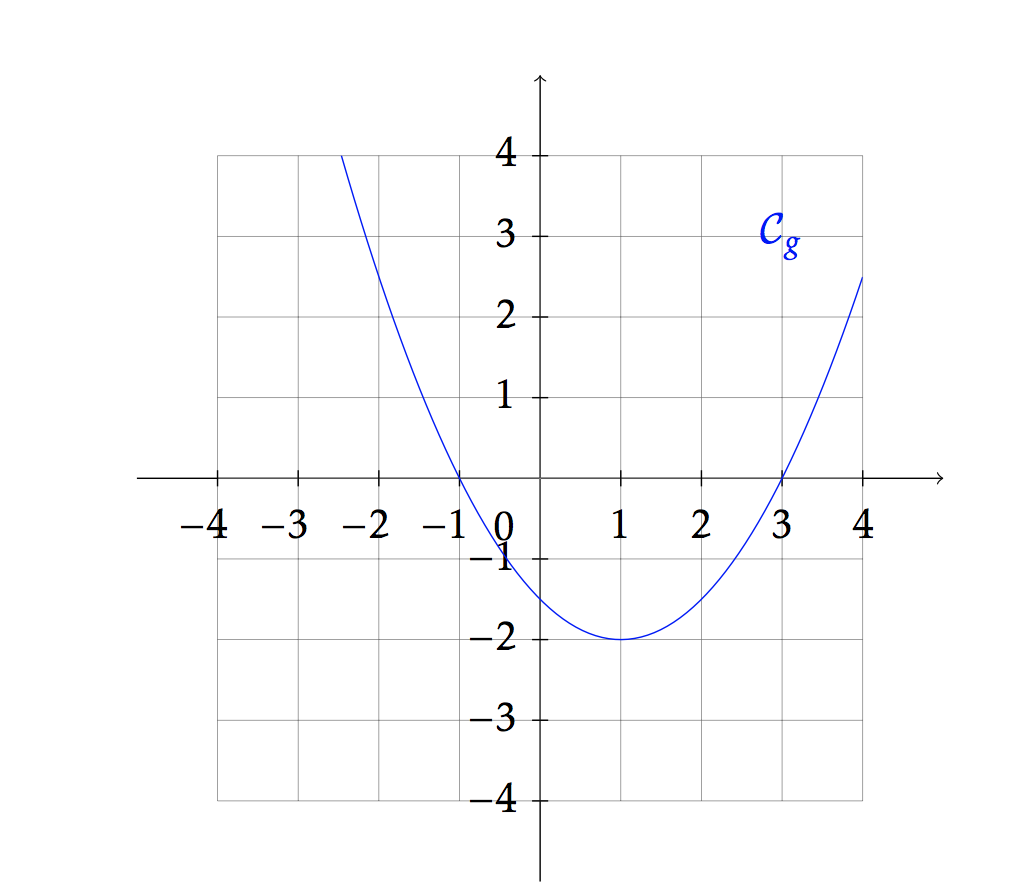
\draw[domain=-4:4,color=blue,samples=100] plot ({\x},{0.5*(\x-1)^2-2}) ;
\draw (3,3) node [color=blue] {$\mathcal{C}_{g}$};
\end{scope}
\end{tikzpicture}\shorthandon{:}\\
\shorthandoff{:}\begin{tikzpicture}[xscale=1,yscale=0.5]
\draw[->] (-5,0) -- (5,0) node[right] {};
\draw[->] (0,-1) -- (0,16) node[above] {};
\foreach \x in {-4,...,-1} {
\draw (\x,0.1cm) -- (\x,-0.1cm) node[below] {$\x\phantom{-}\strut$};
}
\foreach \x in {1,...,4} {
\draw (\x,0.1cm) -- (\x,-0.1cm) node[below] {$\x\strut$};
}
\foreach \y in {2,4,6,8,10,12,14,16} {
\draw (0.1cm,\y) -- (-0.1cm,\y) node[left] {$\y\strut$};
}
\node[below left=0.1cm] at (-0,0) {$0\strut$};
\begin{scope}
\clip (-5,-1) rectangle (5,16);
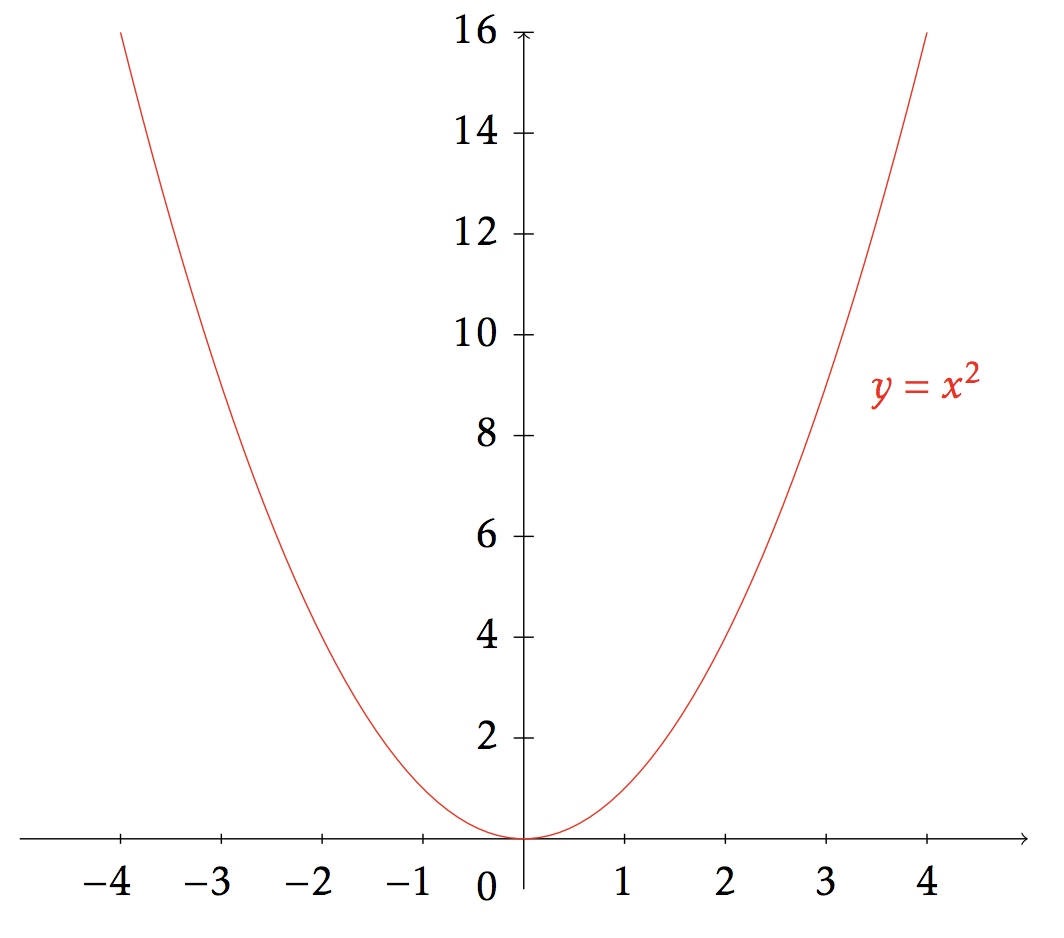
\draw[color=red,samples=100] plot ({\x},{\x^2});\draw (4,9) node [color=red] {$y=x^{2}$};
\end{scope}
\end{tikzpicture}\shorthandon{:}

\shorthandoff{:}\begin{tikzpicture}[scale=1]
\draw[->] (-5,0) -- (5,0) node[right] {};
\draw[->] (0,-5) -- (0,5) node[above] {};
%\draw[xstep=1cm,ystep=2cm,style=help lines] (-4,0) grid (4,16);
\foreach \x in {-5,...,-1} {
\draw (\x,0.1cm) -- (\x,-0.1cm) node[below] {$\x\phantom{-}\strut$};
}
\foreach \x in {1,...,5} {
\draw (\x,0.1cm) -- (\x,-0.1cm) node[below] {$\x\strut$};
}
\foreach \y in {-5,...,-1} {
\draw (0.1cm,\y) -- (-0.1cm,\y) node[left] {$\y\strut$};
}
\foreach \y in {1,...,5} {
\draw (0.1cm,\y) -- (-0.1cm,\y) node[left] {$\y\strut$};
}
\node[below left=0.1cm] at (-0,0) {$0\strut$};
\begin{scope}
\clip (-5,-5) rectangle (5,5);
\draw[domain=-5:-0.001,color=red,samples=100] plot ({\x},{1/\x});
\draw[domain=0.001:5,color=red,samples=100] plot ({\x},{1/\x});
\draw (4,1) node [color=red] {$y=\dfrac{1}{x}$};
\end{scope}
\end{tikzpicture}\shorthandon{:}\\
\shorthandoff{:}\begin{tikzpicture}[scale=1.2]
\draw[->] (-1,0) -- (10,0) node[right] {};
\draw[->] (0,-1) -- (0,4) node[above] {};
\draw[xstep=1cm,ystep=1cm,style=help lines] (0,0) grid (9,3);
\foreach \x in {1,...,9} {
\draw (\x,0.1cm) -- (\x,-0.1cm) node[below] {$\x\strut$};
}
\foreach \y in {1,...,3} {
\draw (0.1cm,\y) -- (-0.1cm,\y) node[left] {$\y\strut$};
}
\node[below left=0.1cm] at (-0,0) {$0\strut$};
\begin{scope}
\clip (0,0) rectangle (10,4);
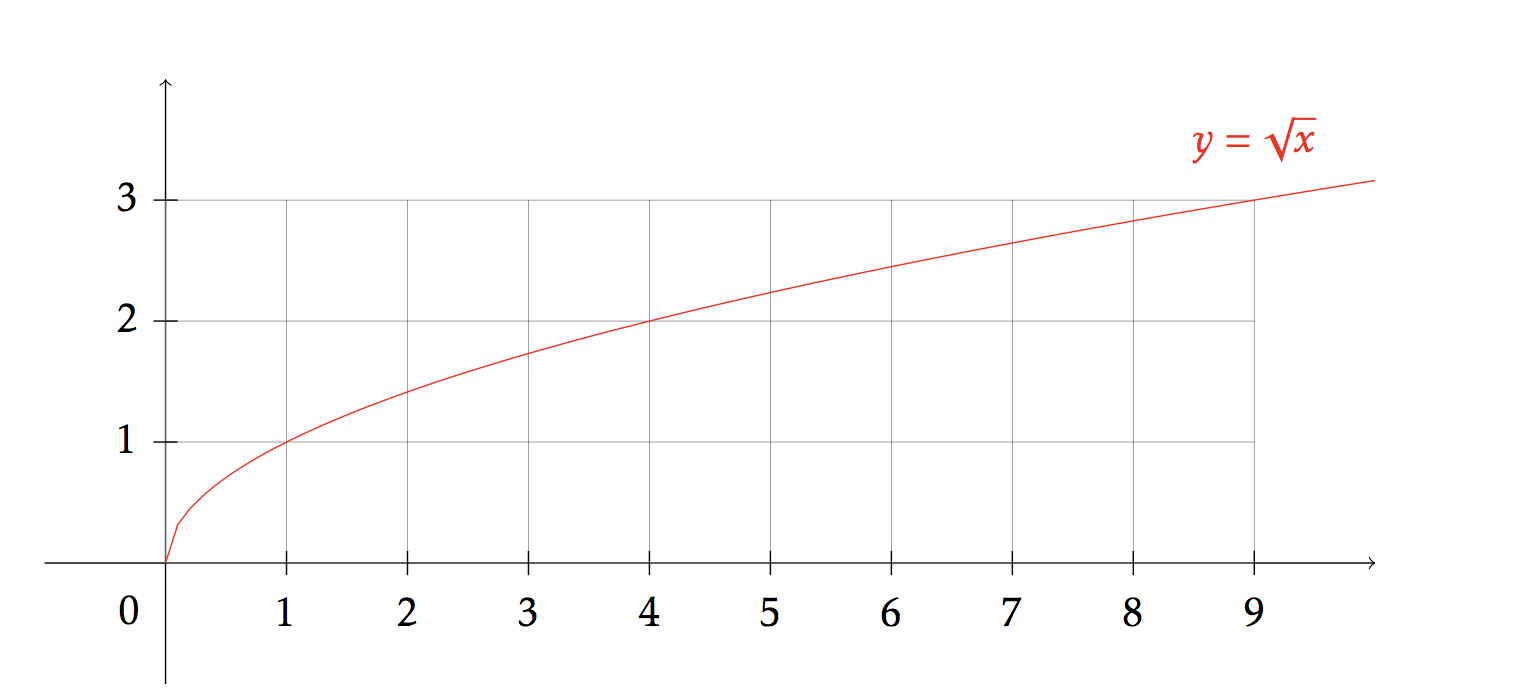
\draw[domain=0:10,color=red,samples=100] plot ({\x},{\x^(1/2)});
\draw (9,3.5) node [color=red] {$y=\sqrt{x}$};
\end{scope}
\end{tikzpicture}\shorthandon{:}\\
\shorthandoff{:}\begin{tikzpicture}[scale=0.7]
\draw[->] (-5,0) -- (5,0) node[right] {};
\draw[->] (0,-1) -- (0,5) node[above] {};
\foreach \x in {-4,...,-1} {
\draw (\x,0.1cm) -- (\x,-0.1cm) node[below] {$\x\phantom{-}\strut$};
}
\foreach \x in {1,...,4} {
\draw (\x,0.1cm) -- (\x,-0.1cm) node[below] {$\x\strut$};
}
\foreach \y in {1,...,4} {
\draw (0.1cm,\y) -- (-0.1cm,\y) node[left] {$\y\strut$};
}
\node[below left=0.1cm] at (-0,0) {$0\strut$};
\begin{scope}
\clip (-5,-5) rectangle (5,5);
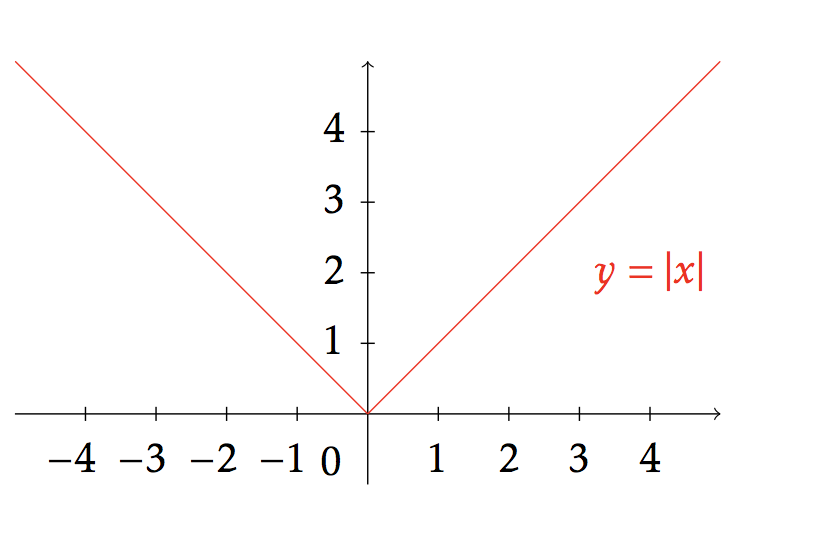
\draw[domain=-5:0,color=red,samples=100] plot ({\x},{-\x});
\draw[domain=0:5,color=red,samples=100] plot ({\x},{\x});
\draw (4,2) node [color=red] {$y=|x|$};
\end{scope}
\end{tikzpicture}\shorthandon{:}\\

\shorthandoff{:}\begin{tikzpicture}[scale=1]
\draw[->] (-1,0) -- (5,0) node[right] {};
\draw[->] (0,-1) -- (0,5) node[above] {};
\draw (\x,0.1cm) -- (\x,-0.1cm) node[below] {$\x\phantom{-}\strut$};
}
\foreach \x in {1,...,4} {
\draw (\x,0.1cm) -- (\x,-0.1cm) node[below] {$\x\strut$};
}
\foreach \y in {1,...,4} {
\draw (0.1cm,\y) -- (-0.1cm,\y) node[left] {$\y\strut$};
}
\node[below left=0.1cm] at (-0,0) {$0\strut$};
\begin{scope}
\clip (-1,-1) rectangle (5,5);
\draw[domain=0:5,color=blue,samples=100] plot ({\x},{\x}) ;
\draw (4,3.5) node [color=blue] {$y=x$};
\draw[domain=0:5,color=red,samples=100] plot ({\x},{\x^0.5});
\draw (4,1.5) node [color=red] {$y=\sqrt{x}$};
\draw[domain=0:5,color=green,samples=100] plot ({\x},{\x^2});
\draw (1,4) node [color=green] {$y=x^{2}$};
\end{scope}
\end{tikzpicture}\shorthandon{:}
\newcounter{j}
\shorthandoff{:}\begin{tikzpicture}[scale=10]
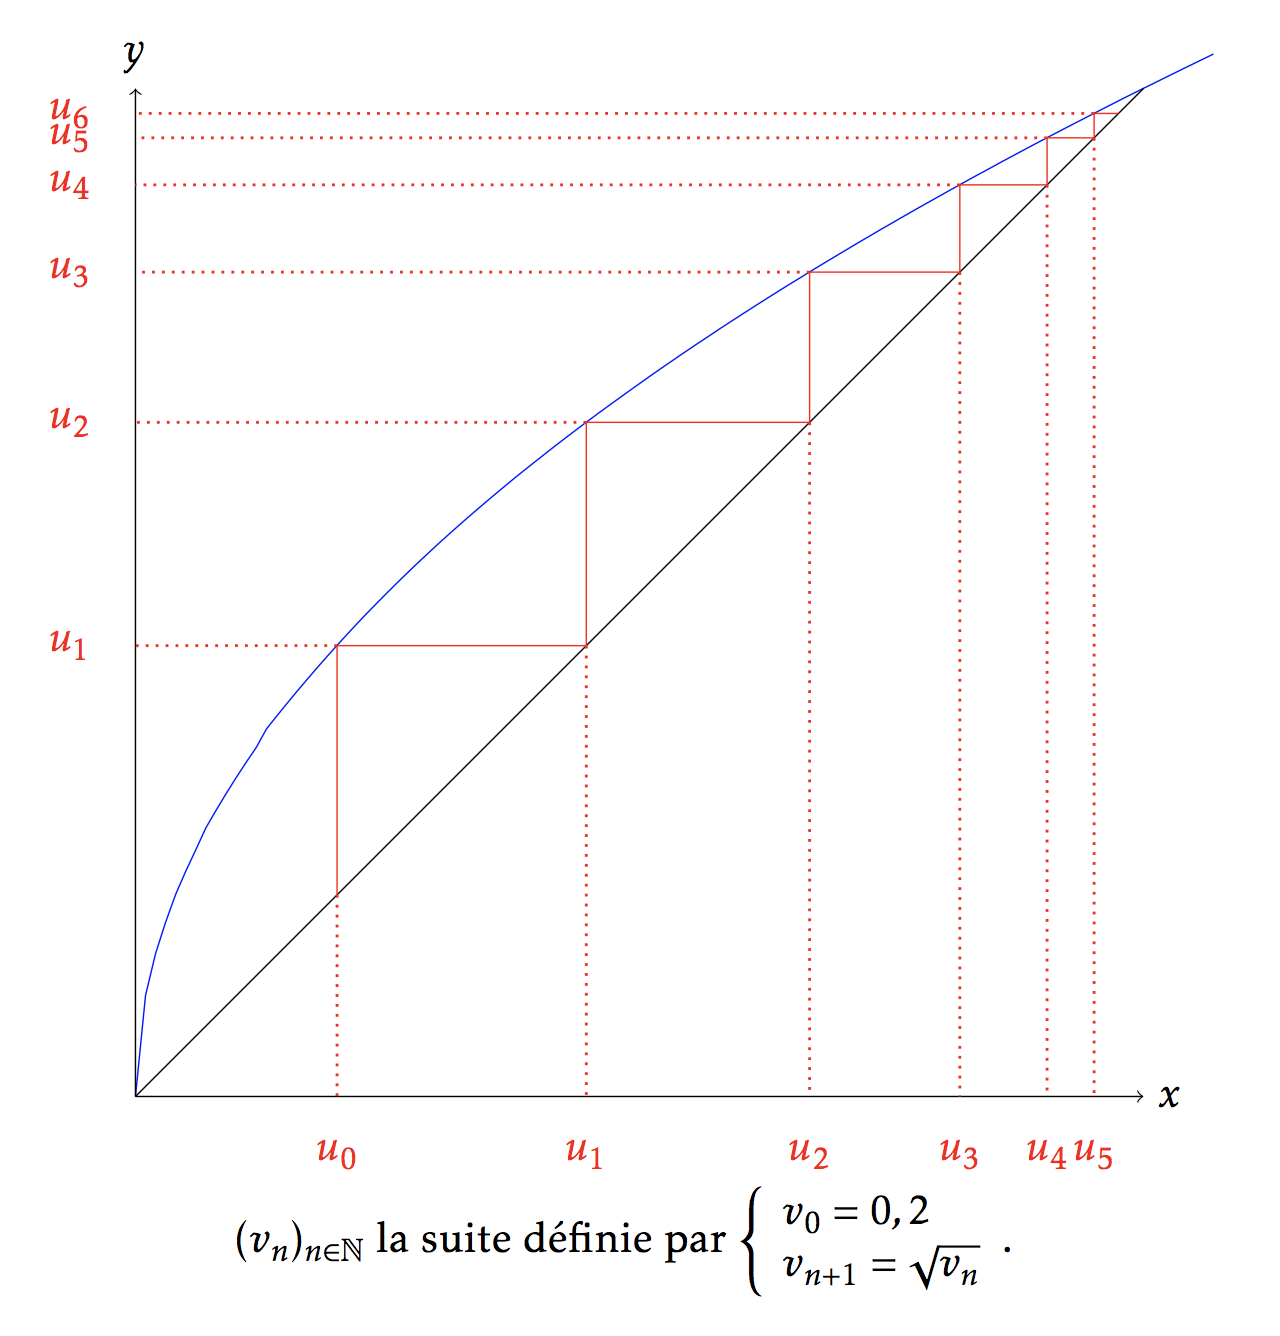
\draw[color=blue,samples at={0,0.01,...,1.07}] plot (\x,{\x^0.5});
\draw[color=black](0,0)--(1,1);
\draw[->](0,0)--(0,1) node[above]{$y$};
\draw[->](0,0)--(1,0) node[right]{$x$};
\newcounter{cnt}
\newcommand{\x}{.2}
\foreach \i in {0,...,5}{%
\pgfmathsqrt{\x}
\let\y\pgfmathresult
\draw[color=red](\x,\x)--(\x,\y)--(\y,\y);
\draw[color=red,dotted,line width=0.8pt](\x,\x)--(\x,0) node[below=8pt]{$u_\i$};
\pgfmathsetcounter{j}{\i+1}
\draw[color=red,dotted,line width=0.8pt](\x,\y)--(0,\y) node[left=8pt] {$u_\thej$};
\global\let\x\y
}
\end{tikzpicture}\shorthandon{:}\\